Last week, we looked at how to choose a test metric, to measure the state of a problem. Just as important, this will allow us to measure the difference our changes are making to the system.
The conclusion was, if we can sustain the load seen at peak ( 20 home page requests per second ), and keep the full request time under 10 seconds, then our problem has now improved.If the response time is worse, or very irregular, then we're moving in the wrong direction.
Now, let's look at how to turn our idea for a test into reality.
Basic performance tests with Jmeter.
We're going to use Jmeter, because it's very easy to get started with. It's not suitable for everything - for example, I'd recommend against using it for microbenchmarking of application components - but it's powerful, flexible, scalable, and easy to use.
Getting started & Thread Groups.
Make sure you have a recent version of Java installed, then install Jmeter from
here.
Now go and install the extra Jmeter plugins
here. These externally managed plugins add a great set of additional tools to Jmeter, including some much needed better graphing.
Then, start Jmeter,you should see Jmeter's main window.
The first thing we need to add is a Thread Group, this controls a few global parameters about how the test will run. eg.
- how many threads (simulated users, in this case).
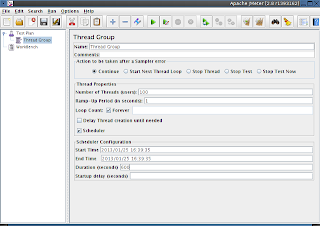
- how long the test takes to ramp up to full user load.
- how many times the thread loop runs.
- how long the thread runs for.
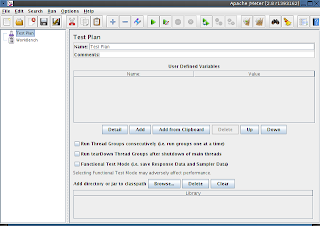
Right click on "Test Plan", choose "Add" --> "Threads" --> "Thread Group"
From our previous investigations, we obtained a few numbers. The first important one is:
"
100 simultaneous active clients" - this is our number of active threads.
Also select "loop count" =
forever, and set the schedule to
600 seconds (10 mins) - don't worry, it will ignore the Start/End time. Unless you know otherwise, always set a reasonable length of time for your tests. 1 minute is often not enough to fully warm-up and saturate a system with load.
Adding Requests Defaults
The first thing we need to add is some global HTTP configuration options.
Right click on the "Thread Group" you added previously, and choose "Add" --> "Config Element" -> "HTTP Cache Manager", repeat for "HTTP Cookie Manager", "HTTP Request Defaults" and "HTTP Header Manager".
In "HTTP Cache Manager", set:
- "Clear cache each iteration". We want each test request to be uncached, to simulate lots of new users going to the site.
In "HTTP Cookie Manager", set
- "Clear cookies each iteration". Again, we want each new simulated user to have never been to the site before, to simulate maximum load.
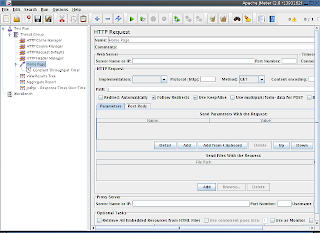
In "HTTP Request Defaults", set
- Any headers that your users browser typically set. eg. "Accept-Encoding", "User-Agent", "Accept-Language". Basically anything to trick the test system into thinking a real browser is connecting.
In "HTTP Request Defaults", set:
- Web Server name or IP - your test system address. Don't use your "live" system, unless you have absolutely no other choice!
- "Port number" - usually 80
- "Retrieve all embedded resources from HTML files" - true - Jmeter does not understand Javascript. This will parse any HTML it finds and retrieve sub-resources, but will not execute javascript to find any resources. If javascript drives web-server requests on your site, you'll need to add those requests manually.
- "Embedded URLs must match" - a regex for your systems web URLs. This is here to prevent you from accidentally load testing any external web hosted files. Likely those external providers will not be happy with you if you do any unauthorised load tests.
Adding the Home Page Request
Now, we can add our home page request.
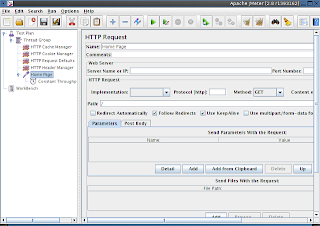
Going back to last week's post again, remember we needed to simulate a load of 20 home page requests per second, and keep the response time under 10 seconds.
Add "Sampler"--> HTTP Request":
name it "
Home Page"
set the URL to "
/" - it will inherit the default values we set earlier, including the server URL to use.
We wanted to simulate 20 home page requests per second, so we need to restrict the test to do that, otherwise it will loop as fast as it can.
Click on the "Home Page" item you just added, then add "Timer" --> "Constant Throughput Timer", then set:
- Target throughput (per min) - 1200 (20 per second)
- Calculate throughput - "All active threads". (this has some disadvantages, but the better solutions are outside the scope of a "getting started" guide!)
Adding analysis plugins.
One of Jmeter's great strengths is it's data-analysis and test-debugging tools, we're going to add the minimum required to our test.
Now add the following "Listeners"
- "View Results Tree" - Used for a quick view on the data you're sending and receiving. Great for a quick sanity check of your test.
- "Aggregate Report" - Aggregated stats about your test run.
- "jp@gc Response Times over Time" - A view of how your response times change over time.
First test run!
If you haven't already done so, save your test.
Now we need to select a place to run our test from. Running a performance test from a slow laptop, connected via WiFi, to a contended DSL line, is not a good idea.
Choose somewhere with suitable CPU power, reliable network links, close to your target environment. The test must be repeatable, without having to worry about contention from other systems or processes.
Run the test.
Analysing test results.
You should keep detailed notes about each test run, noting the state of the environment, and any changes you've made to it. Version your tests, as well as keeping records of the result. The ability to look back in a spreadsheet, to look at results from a similar test weeks ago, is very valuable.
Here's a quick look at an example result.
- Results Tree - each result should come up in green, showing a 2xx response from the server. By default, Jmeter treats non 2xx response codes as a failure. This view allows you to do a quick debug of your test requests and responses to ensure it's behaving as you expect. Once the test works correctly, disable the results tree, as it slows down the test.
- Aggregate Report - statistics about each request type that was made. (Taken from an unrelated test).
- Response Times over Time - self explanatory. (Taken from an unrelated test)
Automation.
For the most reliable results, you shouldn't run the tests in interactive mode, with live displays and analysis. It skews the results slightly, as your computer is wasting CPU cycles processing the displays.
Instead, using command line mode, disable all the analysis tools, and use the
Simple Data Writer to write a file to disk with the results, for later analysis. All the analysis plugins that I've used here accept data loaded back from one of these results files, so you can analyse and re-analyse results files at your leisure.
I'll cover the techniques to run Jmeter tests in an automated fashion, with automated analysis, in a future blog post.
Conclusion
We've now got a repeatable way to measure our chosen performance metric(s).
In our
imaginary case, we're going to pretend that the test we ran showed that Home page load speed averaged 15 seconds across our 10 min test, and that the Response Time over Time started out at approximately 5 seconds, and increased to 15 seconds within a few minutes of test start.
In this example, this shows our test is part of the
cause, and not just an
effect. If we had run the test, and found that response times were acceptable, then our test would have just been measuring the
effect.
Measuring only the
effect is not a bad thing, as it gives us acceptance criteria for fixing the problem, but it means we would have to look for the
cause later on, after we've instrumented the environment.
Next time, I'll cover how to approach instrumenting the environment, to collect the data we need to know what's happening to the environment.


