Monday 4 February 2013

Production quality Play apps. - part 3 - Using JMX to monitor and tune Play applications


Play Framework applications use the JVM in the same way as any other Java application. In the previous article, I showed a start script for a Netty based play application that enabled JMX in a secure way, so we can monitor the status of the JVM.

Finding JMX connectivity details


Here's an example of a running Play process.


995      18203     1  1 03:49 ?        00:09:17 java -Dhttp.port=9000 -Dhttp.address=0.0.0.0 -Dcom.sun.management.jmxremote.port=7020 -Dcom.sun.management.jmxremote.ssl=false -Dcom.sun.management.jmxremote.password.file=/etc/play/play_app/jmxremote.password -Dcom.sun.management.jmxremote.access.file=/etc/play/play_app/jmxremote.access -Dcom.sun.management.jmxremote.authenticate=true -Djava.rmi.server.hostname=10.11.12.13 -XX:+UseConcMarkSweepGC -Xloggc:/opt/play_app/logs/gc.log -XX:-OmitStackTraceInFastThrow -XX:+PrintGCDateStamps -verbose:gc -Xms256M -Xmx256m -server -Dconfig.file=/etc/play/play_app/env-application.conf -Dlogger.file=/etc/play/play_app/env-logger.xml -cp /opt/play_app/lib/* play.core.server.NettyServer /opt/play_app/

From this, you can extract the JMX port (jmxremote.port=7020), and find the JMX username/password file (jmxremote.password) - All three bits of information are necessary to connect.

GC Logging


We can also check the GC log if necessary (Xloggc:/opt/play_app/logs/gc.log)  - The information isn't quite as good as using JMX directly, but is useful for a quick diagnosis of a problem.

Essentially, lines like this show normal GC activity.

2013-02-04T17:06:16.627+0000: 47827.125: [GC 383171K->349037K(1044352K), 0.0158340 secs]
2013-02-04T17:12:34.481+0000: 48204.979: [GC 383149K->349028K(1044352K), 0.0193200 secs]
2013-02-04T17:18:56.583+0000: 48587.081: [GC 383140K->349008K(1044352K), 0.0204980 secs]
2013-02-04T17:25:17.088+0000: 48967.586: [GC 383120K->349015K(1044352K), 0.0058240 secs]

Note the last field - GC time in seconds. This should be nice and low - certainly sub-second.

Out-of-memory problems would lead to a log with repeated Full GC lines - similar to:

2013-01-18T10:53:42.184+0000: 4886909.890: [Full GC 2088630K->2055966K(2088640K), 6.4534550 secs]
2013-01-18T10:53:51.453+0000: 4886916.393: [GC 2080393K(2088640K), 0.0550080 secs]
2013-01-18T10:53:51.576+0000: 4886919.258: [Full GC 2088639K->2053535K(2088640K), 6.2507810 secs]
2013-01-18T10:54:00.613+0000: 4886925.553: [GC 2077526K(2088640K), 0.0533610 secs]
2013-01-18T10:54:00.728+0000: 4886928.562: [Full GC 2088633K->2055761K(2088640K), 6.3442360 secs]
2013-01-18T10:54:09.999+0000: 4886934.939: [GC 2079647K(2088640K), 0.0538060 secs]
2013-01-18T10:54:10.115+0000: 4886937.753: [Full GC 2088638K->2057070K(2088640K), 6.1674520 secs]
2013-01-18T10:54:19.016+0000: 4886943.956: [GC 2081495K(2088640K), 0.0553910 secs]
2013-01-18T10:54:19.118+0000: 4886946.803: [Full GC 2088639K->2054971K(2088640K), 6.1280980 secs]
2013-01-18T10:54:28.024+0000: 4886952.964: [GC 2081821K(2088640K), 0.0521580 secs]
2013-01-18T10:54:28.106+0000: 4886956.119: [Full GC 2088639K->2060868K(2088640K), 6.3114750 secs]
2013-01-18T10:54:37.534+0000: 4886962.475: [GC 2081790K(2088640K), 0.0520260 secs]
2013-01-18T10:54:37.636+0000: 4886965.448: [Full GC 2088639K->2058876K(2088640K), 6.1640440 secs]
2013-01-18T10:54:46.712+0000: 4886971.653: [GC 2080842K(2088640K), 0.0571690 secs]
2013-01-18T10:54:46.807+0000: 4886974.582: [Full GC 2087100K->2059338K(2088640K), 6.2864710 secs]
2013-01-18T10:54:55.971+0000: 4886980.911: [GC 2083885K(2088640K), 0.0530780 secs]
2013-01-18T10:54:56.059+0000: 4886983.794: [Full GC 2088605K->2058919K(2088640K), 6.3044720 secs]
Note that Full GC is taking approx 6 seconds each time here, making the application unusable.

Using Jconsole with the JVM running Play.


Jconsole is an application shipped with the Oracle JVM (and others) that enables us to connect to the JVM remotely via JMX and view internal metrics. Here's a very brief introduction to what it can do.


The preferred way to run it, is to run jconsole on your personal machine, and connect remotely to the application JVM. Start it up, feed it:
the address of the machine running the application, the port it's running on
the username and password for JMX.


Here's Jconsole's overview screen. Important things to note here are CPU usage of the application, and the memory consumption. 

This sawtooth memory consumption graph is ideal - The base of the sawtooth should be flat - indicating memory usage after garbage collection is stable, and not increasing. Continuously increasing base memory usage could indicate a memory leak, code deficiencies, or simply insufficient memory assigned.


Here's the display of the memory and GC statistics. Compare the graph values to the Max values on the display below to show much of the heap has been used.

Keep an eye on the GC time values in the lower value.
The New Generation (ParNew in this case) should tick up gradually, but in a tiny fraction of realtime.
The Old Generation (CMS in this case), should tick up very occassionally - and in tens to hundreds of a second chunks.


Explaining how to do GC tuning and analysis of memory usage is worth a series of articles on it's own, and this is a subject I'll cover at a later date. Until then, here a good article to get you started.

Collecting JMX data

GC logging is a relatively blunt tool, though log analysis tools like GCViewer help. Similarly, you can't really leave jconsole connected 24/7 to see what your application is doing.

The answer is to collect selected JMX metrics with another application, and store them. There are many applications that can do this - some of my favourites are.


Having high-resolution JMX data at the time a problem occurred can be invaluable in solving problems, as you can trace what was happening immediately before the problem occurred.


Production quality Play apps. - part 2 - Puppet module


In the previous article, I went through a few common options for getting your Play code onto a target system in a controlled manner.

Now, here's the puppet module I use for configuring and running the Play application itself - you can download it from http://www.jmips.co.uk/play_framework/ -  This should be easy to get working with some basic Puppet experience.

Unpack play_framework_apps_with_puppet.tar.gz , and you should see two modules - "example_play_app", and "play_framework".

The "play_framework" module is a puppet defined type. The idea is you call it, as in  example_play_app/manifests/init.pp

  # this defined-type does all the heavy lifting to create a service
  # for play_framework stuff, we just need to feed it a name and uid/gid
  play_framework::play_service { "${module_name}":
    play_uid => '995',
  }

Example Play App module


By default, they play app will take it's name from the module name - so likely you'll want to rename it at some point. After you've renamed the module directory and class name, you need to choose a free UID to run your play application under. The name of the user created will be named after the application. Beware - avoid hypthens in puppet module names! It is possible to use hyphens, but it will complicate things.

After you've chosen a name and UID, take a look at the templates directory for the example play apps.

./templates/env-logger.xml.erb
./templates/start_script.erb
./templates/env-application.conf.erb
The first file is the logger configuration - you should configure your play application to look for this file, and configure it appropriately

The second is the script used to start the application - you should adjust this to your needs.

#!/usr/bin/env sh
exec java -Dhttp.port=9000 \
-Dhttp.address=0.0.0.0 \
-Dcom.sun.management.jmxremote.port=7020 \
-Dcom.sun.management.jmxremote.ssl=false \
-Dcom.sun.management.jmxremote.password.file=/etc/play/<%= module_name %>/jmxremote.password \
-Dcom.sun.management.jmxremote.access.file=/etc/play/<%= module_name %>/jmxremote.access \
-Dcom.sun.management.jmxremote.authenticate=true \
-Djava.rmi.server.hostname=<%= ipaddress %> \
-XX:+UseConcMarkSweepGC \
-Xloggc:/opt/<%= module_name %>/logs/gc.log \
-XX:-OmitStackTraceInFastThrow \
-XX:+PrintGCDateStamps \
-verbose:gc \
-Xms256M -Xmx256m \
-server  \
-Dconfig.file=/etc/play/<%= module_name %>/env-application.conf \
-Dlogger.file=/etc/play/<%= module_name %>/env-logger.xml \
-cp "/opt/<%= module_name %>/lib/*" play.core.server.NettyServer /opt/<%= module_name %>/

In this application we're using Netty, configured to run on port 9000 and JMX is enabled with a username/password. Java heap size is set to 256Mb, CMS GC is enabled, GC logging is enabled. All of the file locations use the puppet module name.

The third file -  env-application.conf.erb  - contains application specific configuration. Use this to set configuration that varies between environments - ie where a database server is located.

Play Framework module

The defined type module may need some adjusting for your environment, the one I use is configured for Ubuntu, using Upstart to run the Play service.

Again, take a look in the templates directory for this module.
./templates/jmxremote.password.erb
./templates/play_upstart.conf.erb
./templates/jmxremote.access.erb
The JMX files relate to the usernames/passwords and permissions for JMX connectivity. See this document to set this up correctly. My templates use puppet variables to allow for multiple play apps/jmx passwords. Either set these variables in your site manifests via extlookup, or hardcode the JMX config into the modules (not recommended for good security!)

The Upstart file is used to start, stop and monitor the Play application.

description "<%= play_service_name %>"
start on filesystem
stop on runlevel [!2345]
respawn
respawn limit 10 5
umask 022
oom never
env PLAY_SERVICE_HOME="/opt/<%= play_service_name %>"
post-stop script
        rm ${PLAY_SERVICE_HOME}/RUNNING_PID || true
end script
exec start-stop-daemon --start -c <%= play_service_name %> -d ${PLAY_SERVICE_HOME} --exec /etc/play/<%= play_service_name %>/start

Upstart will ensure the application is running, monitor it via it's PID, and restart it if it crashes. You should be able to start/stop/restart the service with "service example_play_app <stop/start/restart>"


Hopefully this should be enough to get your play application started and running. Next time, I'll briefly cover using JMX to monitor and tune the JVM of your Play application.

Friday 1 February 2013

Production quality Play apps. - part 1 - Automatic Deployment

I've been working with a lot of Play applications recently, and was asked to share how I built the automatic deployment, config management, integration into Linux, etc.

In this post I'll cover the automatic deployment options, and it will be solely focused on how to get binaries onto systems in a controlled and repeatable fashion.


Automatic Deployment 


This all assumes you have a working build of your Play application already.

I'm showing the raw commands to run to get it to work, but this all should be scripted/automated with your automation system of choice. Here's an example shell script, but Mcollective or Saltstack should work too.

Method 1 - Quick and dirty - Deploy straight from Jenkins


This is quite simple, and perfect for a fast deploy from a Build/Test system. I would recommend not using this for production deployments, as it's difficult to guarantee the exact version of what you're deploying!

This assumes you have a working Play app build in Jenkins, and successfully built binaries, usually with SBT's "dist" command.

On your target server to run the Play application.
wget -nv http://<jenkins_server>/job/<play_jenkins_job>/lastSuccessfulBuild/artifact/*zip*/archive.zip -O /tmp/play_deploy/archive-<play_app_name>.zip

This just retrieves the latest Jenkins artifact for the build job, and writes it to a known location on disk
 unzip -q -o /tmp/play_deploy/archive-<play_app_name>.zip  -d /tmp/play_deploy/
Here we unpack the Jenkins ZIP artifact, to reveal the actual Play ZIP file.
cd /tmp/play_deploy/ unzip -q /tmp/play_deploy/archive/dist/<play_zip_name>-*.zip
Here we've unpacked the SBT built ZIP distribution of the Play libs.
sudo /bin/rm -rf /opt/<play_service_name>/lib
Clean up the final destination for the Play app - assuming you've stopped it already!
sudo /bin/mv /tmp/play_deploy/<play_unzipped_dir>-*/* /opt/<play_service_name>/ "
The result of this should be /opt/<play_service_name>/lib filled with the libraries from your Play application. You will likely have to tweak the names slightly, as the outer ZIP wrapper is related to the name of the Jenkins job, and the inside ZIP name is related to the Play project name.

At this point, you're ready for Puppet to take over.

Method 2 - Deploy from a binaries file store.


It's quite common to use a build system to populate a filesystem based binary store. eg. /mnt/play_binaries/<play_project_name>/<version>/<project_name>.zip

Implementing this is outside the scope of this article, but I'd use the Copy Artifact plugin in Jenkins.

To deploy from this, use wget/rsync or similar to copy the file to your target system in the /tmp/play_deploy/ directory, then, as the previous example

cd /tmp/play_deploy/ 
unzip -q /tmp/play_deploy/archive/dist/<play_zip_name>-*.zip 
sudo /bin/rm -rf /opt/<play_service_name>/lib
sudo /bin/mv /tmp/play_deploy/<play_unzipped_dir>-*/* /opt/<play_service_name>/ "

Again, at this point you should have /opt/<play_service_name>/lib populated with the Play application libraries, and you're ready for Puppet to take over the next step.

Method 3 - Deploy from Maven.


This assumes you've published your binaries to Maven, using SBT or similar, as in this example.
Be aware that SBT 0.11 does not properly generate the Maven metadata, the result of which is asking for the "latest" version will not work, but asking for a specific version will. See here for a solution, particularly the sbt-aether-deploy plugin.

If you chose to use Maven for deployment, be sure you know the difference between Release and Snapshot versions, so you're able to guarantee the versions of your code, and all dependencies in each production release.

To deploy, you'll need a custom maven XML file like this one, on the target system. - call it <play_app_name>.xml

<project xmlns="http://maven.apache.org/POM/4.0.0" xmlns:xsi="http://www.w3.org/2001/XMLSchema-instance" xsi:schemaLocation="http://maven.apache.org/POM/4.0.0 http://maven.apache.org/xsd/maven-4.0.0.xsd">
  <modelVersion>4.0.0</modelVersion>
  <groupId>com.fake</groupId>
  <artifactId>fake</artifactId>
  <version>1.0</version>
  <packaging>jar</packaging>
  <name>fake</name>
  <url>http://maven.apache.org</url>
<properties>
<project.build.sourceEncoding>UTF-8</project.build.sourceEncoding>
<excludeTransitive>false</excludeTransitive>
<outputDirectory>/tmp/play_deploy/play_service_name/lib/</outputDirectory>
</properties>
<dependencies>
<dependency>
<groupId>com.mycompany</groupId>
<artifactId>my_play_artifact name</artifactId>
<version>version_to_deploy</version>
<type>jar</type>
</dependency>
</dependencies>
</project>


Assuming you've got your local Maven config set up correctly (ie. your ~/.m2/settings.xml as in this example ) so Maven on your target system can see your internal Maven repo, you can now use Maven to request your libraries.


cd /tmp/play_deploy/ 
mvn -U    dependency:copy-dependencies -f <play_app_name>.xml


This should result in the version you selected in the XML file being deployed to the path you specified in the XML file, along with all dependencies required to run it.

Now, as before, move it to the correct place.

sudo /bin/rm -rf /opt/<play_service_name>/lib
sudo /bin/mv /tmp/play_deploy/<play_service_name>-*/* /opt/<play_service_name>/ "

 Now the code is deployed, you're ready for Puppet to take over.

Method 4 - System Packaging


Systems Admins already have tools to automatically check/deploy/upgrade the software on the systems under their control. RPM and deb are the most popular formats for Linux

Converting Play applications (typically distributed in ZIP format) into these formats is a little more involved, but worth it for larger system estates. I'll describe the process, but the specifics are a little outside a blog post. Perhaps I'll cover it in the future.

Essentially, the idea is as part of your build process, to take the ZIP file, convert it into a RPM/deb, then upload it to your repository. Then it will be available to be installed, using native OS commands, as if you were installing a new version of Apache HTTPD.

This project aims to bring this support natively to SBT, but until then, you're going to have to script this yourself, with the help of some Jenkins plugins like this.


Next time I'll cover the Puppet module I use to automate the configuration and integration of the Play app into the Linux environment.


Friday 25 January 2013

Performance Analysis - Part 3: Develop performance tests


Last week, we looked at how to choose a test metric, to measure the state of a problem. Just as important, this will allow us to measure the difference our changes are making to the system.

The conclusion was, if we can sustain the load seen at peak ( 20 home page requests per second ), and keep the full request time under 10 seconds, then our problem has now improved.If the response time is worse, or very irregular, then we're moving in the wrong direction.
Now, let's look at how to turn our idea for a test into reality.

Basic performance tests with Jmeter.


We're going to use Jmeter, because it's very easy to get started with. It's not suitable for everything - for example, I'd recommend against using it for microbenchmarking of application components - but it's powerful, flexible, scalable, and easy to use.

Getting started & Thread Groups.


Make sure you have a recent version of Java installed, then install Jmeter from here.
Now go and install the extra Jmeter plugins here. These externally managed plugins add a great set of additional tools to Jmeter, including some much needed better graphing.


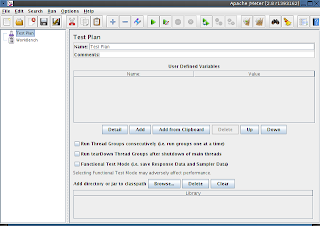
Then, start Jmeter,you should see Jmeter's main window.


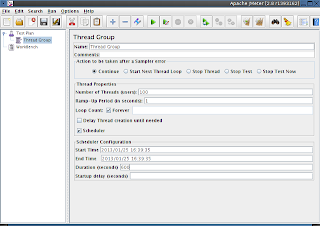
The first thing we need to add is a Thread Group, this controls a few global parameters about how the test will run. eg.


  • how many threads (simulated users, in this case).


  • how long the test takes to ramp up to full user load.
  • how many times the thread loop runs.
  • how long the thread runs for.


Right click on "Test Plan", choose "Add" --> "Threads" --> "Thread Group"

From our previous investigations, we obtained a few numbers. The first important one is:
"100 simultaneous active clients" - this is our number of active threads.

Also select "loop count" = forever, and set the schedule to 600 seconds (10 mins) - don't worry, it will ignore the Start/End time. Unless you know otherwise, always set a reasonable length of time for your tests. 1 minute is often not enough to fully warm-up and saturate a system with load.

Adding Requests Defaults


The first thing we need to add is some global HTTP configuration options.
Right click on the "Thread Group" you added previously, and choose "Add" --> "Config Element" -> "HTTP Cache Manager", repeat for "HTTP Cookie Manager", "HTTP Request Defaults" and "HTTP Header Manager".

In "HTTP Cache Manager", set:

  • "Clear cache each iteration". We want each test request to be uncached, to simulate lots of new users going to the site.


In "HTTP Cookie Manager", set

  • "Clear cookies each iteration". Again, we want each new simulated user to have never been to the site before, to simulate maximum load.


In "HTTP Request Defaults", set

  • Any headers that your users browser typically set. eg. "Accept-Encoding", "User-Agent", "Accept-Language". Basically anything to trick the test system into thinking a real browser is connecting. 


In "HTTP Request Defaults", set:

  • Web Server name or IP  -  your test system address. Don't use your "live" system, unless you have absolutely no other choice!
  • "Port number" -  usually 80
  • "Retrieve all embedded resources from HTML files" - true - Jmeter does not understand Javascript. This will parse any HTML it finds and retrieve sub-resources, but will not execute javascript to find any resources. If javascript drives web-server requests on your site, you'll need to add those requests manually.
  • "Embedded URLs must match" - a regex for your systems web URLs. This is here to prevent you from accidentally load testing any external web hosted files. Likely those external providers will not be happy with you if you do any unauthorised load tests.


Adding the Home Page Request


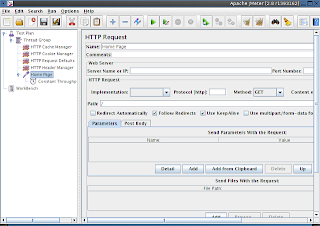
Now, we can add our home page request.

Going back to last week's post again, remember we needed to simulate a load of 20 home page requests per second, and keep the response time under 10 seconds.

Add "Sampler"--> HTTP Request":
name it "Home Page"
set the URL to "/" - it will inherit the default values we set earlier, including the server URL to use.


We wanted to simulate 20 home page requests per second, so we need to restrict the test to do that, otherwise it will loop as fast as it can.

Click on the "Home Page" item you just added, then add "Timer" --> "Constant Throughput Timer", then set:

  • Target throughput (per min) - 1200  (20 per second)
  • Calculate throughput - "All active threads". (this has some disadvantages, but the better solutions are outside the scope of a "getting started" guide!)


Adding analysis plugins.


One of Jmeter's great strengths is it's data-analysis and test-debugging tools, we're going to add the minimum required to our test.

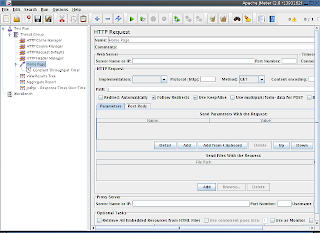
Now add the following "Listeners"


  • "View Results Tree" - Used for a quick view on the data you're sending and receiving. Great for a quick sanity check of your test.
  • "Aggregate Report" - Aggregated stats about your test run.
  • "jp@gc Response Times over Time" - A view of how your response times change over time.


First test run!


If you haven't already done so, save your test.

Now we need to select a place to run our test from. Running a performance test from a slow laptop, connected via WiFi, to a contended DSL line, is not a good idea.

Choose somewhere with suitable CPU power, reliable network links, close to your target environment. The test must be repeatable, without having to worry about contention from other systems or processes.

Run the test.


Analysing test results.


You should keep detailed notes about each test run, noting the state of the environment, and any changes you've made to it. Version your tests, as well as keeping records of the result. The ability to look back in a spreadsheet, to look at results from a similar test weeks ago, is very valuable.

Here's a quick look at an example result.


  • Results Tree - each result should come up in green, showing a 2xx response from the server. By default, Jmeter treats non 2xx response codes as a failure. This view allows you to do a quick debug of your test requests and responses to ensure it's behaving as you expect. Once the test works correctly, disable the results tree, as it slows down the test.


  • Aggregate Report - statistics about each request type that was made. (Taken from an unrelated test).


  • Response Times over Time - self explanatory. (Taken from an unrelated test) 


Automation.


For the most reliable results, you shouldn't run the tests in interactive mode, with live displays and analysis. It skews the results slightly, as your computer is wasting CPU cycles processing the displays.

Instead, using command line mode, disable all the analysis tools, and use the Simple Data Writer to write a file to disk with the results, for later analysis. All the analysis plugins that I've used here accept data loaded back from one of these results files, so you can analyse and re-analyse results files at your leisure.

I'll cover the techniques to run Jmeter tests in an automated fashion, with automated analysis, in a future blog post.

Conclusion


We've now got a repeatable way to measure our chosen performance metric(s).
In our imaginary case, we're going to pretend that the test we ran showed that Home page load speed averaged 15 seconds across our 10 min test, and that the Response Time over Time started out at approximately 5 seconds, and increased to 15 seconds within a few minutes of test start.

In this example, this shows our test is part of the cause, and not just an effect. If we had run the test, and found that response times were acceptable, then our test would have just been measuring the effect.

Measuring only the effect is not a bad thing, as it gives us acceptance criteria for fixing the problem, but it means we would have to look for the cause later on, after we've instrumented the environment.


Next time, I'll cover how to approach instrumenting the environment, to collect the data we need to know what's happening to the environment.


Saturday 19 January 2013

Performance Analysis - Part 2: Choosing a test metric


In the previous post, I discussed how to start the process of gathering all the information together that you need to understand the system you're troubleshooting.

Now, let's try and understand how to select a metric for measuring the state of the problem you need to troubleshoot.

Describing the Problem:

Unfortunately, the first contact with a new problem usually starts with the wonderfully unhelpful statement. "My XYZ site/widget/job is slow"....

SysAdmins/Support people will recognise this as similar to "My computer doesn't work". It doesn't tell you much about the problem!


So the point of this exercise is to:

  1. Clarify the problem
  2. Verify the problem and record it in progress
  3. Narrow down exactly how to measure the problem


Clarify the problem


If we take the very simple LAMP stack environment from my previous post as an example....


On closer questioning, the clients report that the web-site home page starts being very slow, all of a sudden, and that this happens at random intervals, and that the site quickly becomes unusable.

Verify the problem and record it in progress

In this case,  it's time to break out tcpdump and wireshark. I'll delve into the details about how to use them to track changes in response time in another post, this post on another blog seems relevant.

Interrogating our imaginary packet capture from in front of the loadbalancer, we see a large number of HTTP requests incoming. They consist of a few static files, and a dynamic request. The response time for the static files seem a little changeable, but the dynamic requests seem hugely variable in response times. Eventually the site dies. Home page requests increase to approximately 20 per second at peak.

You could also verify this by looking at load balancer metrics (if it's smart enough), or by instrumenting the Apache servers to record request time, and analysing the logs (only if you're sure the load-balancer is not part of the problem!). I'll describe how to start instrumenting Apache in a later post.

Narrow down exactly how to measure the problem

The accepted standard for the time a user will wait before getting bored, is about 10 seconds.

If we can sustain the load seen at peak ( 20 home page requests per second ), and keep the full request time under 10 seconds, then our problem has now improved.
If the response time is worse, or very irregular, then we're moving in the wrong direction.

We now have a metric to measure the problem by.

Cause or Effect?

The metric we have chosen may not represent the actual problem, it may just be an effect of the problem. At this stage, this doesn't matter, we're just after a metric that measures the effect.


Next time:

 In the next post I'll look at how to use Jmeter to try and replicate the problem, and test for improvements.


Tuesday 15 January 2013

Performance Analysis - Part 1: Understanding interactions inside IT environments


My first post was about the general process around doing performance analysis in a scientific fashion.

Now I'm going to dive into a process I use to understand large, interconnected IT systems. Having a good mental model of how a system interacts with it's components is essential. It's very difficult to form useful hypotheses about problems, if you don't have an idea of the data flows and connection interactions involved.

Bear with me, this is a long one, but fear not, there are diagrams!

Needless to say, experience with the software and hardware you're investigating is pretty essential. It's difficult to know what "normal" looks like, if you haven't seen it before!

I always start these processes with a diagram - even if it's in my head, or on a whiteboard.

Now for the diagrams!


Below is a hybrid physical/logical diagram of a very simple LAMP system.


Here I'm adding some simple information about system specifications.
 nothing too technical ;-)


I'm now going to add TCP connection information to the diagram.

  • The Clients TCP connection terminates on the loadbalancer
  • The loadbalancer talks to the PHP servers over a seperate TCP connection.
  • The PHP servers talk TCP to MySQL.


This is important, because it marks the boundaries between potentially independent moving parts of the system, as well as reminding us that there's possibly some potential in optimising connection overheads, and the network stack.

This diagram assumes that there's either no NAT/firewall, or that the loadbalancer is doing it itself. If we ran an independent firewall, or had Layer 3/4 loadbalancing, the TCP connection paths would look a little different.


Here's some information about the thread pools available on different parts of the system.

This shows a reasonably well matched system in thread-pool terms (for an arbitrary web site workload).

I have in the past encountered some very mismatched configurations, but we'll talk about the effects of getting thread pools wrong in another blog post.


And lastly, any application specific information that might be relevant.

This may come from knowledge of the business, talking to Developers, as well as direct knowledge of important settings in the applications and infrastructure used.


Still here?

At this point, you should be able to take an imaginary requests from a client, and trace the interactions all the way through the system. Bear in mind that your knowledge of this system is far from complete yet, and parts of it may be wrong! This is just a starting point.

Next time I'll walk you through choosing a metric to use as a basis for a performance test. Check back on http://www.jmips.co.uk/blog soon.


The basics of infrastructure/app performance troubleshooting.


Hopefully this will be the first in a series of posts trying to demystify the black art of performance testing and analysis on Linux based infrastructure.

There seems to be a lot of confusion around the processes involved, and how you get results. Note, I'm not saying this is the only way to do it, but these methods do get results!

I'm going to go over the basic steps involved first, and then dive into each step in detail in later posts.


  1. Using all available sources of information, create a mental model of how the system you're testing operates, and how the components interact with each other.
  2. Find a metric that shows the problem, and hence shows any improvements or regressions after changes.
  3. Develop performance tests ( synthetic or realistic ) that reliably demonstrates this test metric.
  4. Instrument the infrastructure to collect very high resolution data for various infrastructure metrics, through Network, OS, applications.
  5. Use the information., data collected, and your test results to make a hypothesis about the source of the problem, or bottleneck.
  6. Make a change, to infrastructure or application, to test your hypothesis.
  7. Re run tests, noting differences in performance test results, and changes in Infrastructure metrics.
  8. Use these test results to adjust your understanding of the system, and where the problem is.
  9. Repeat steps 5-8

Overall, the most important thing to remember is to be scientific!

DO:
  • Be ruthless in making sure that the data supports the conclusions you are drawing.
  • Use a configuration management tool like Puppet to record all the changes you're making.

DONT:
  • Leave "test changes" in the system, if they've not helped.
  • Test systems in Production use, if you can possibly avoid it.